The project tree
Everything in Visual Dynamics starts from the project tree. It lists what the project holds, and what is selected in it decides what the right-hand side shows — one object on its own, records or modes picked inside one, or several objects together. The readings a combination gives are where much of the application lives, and this page shows every one of them.
What the tree shows
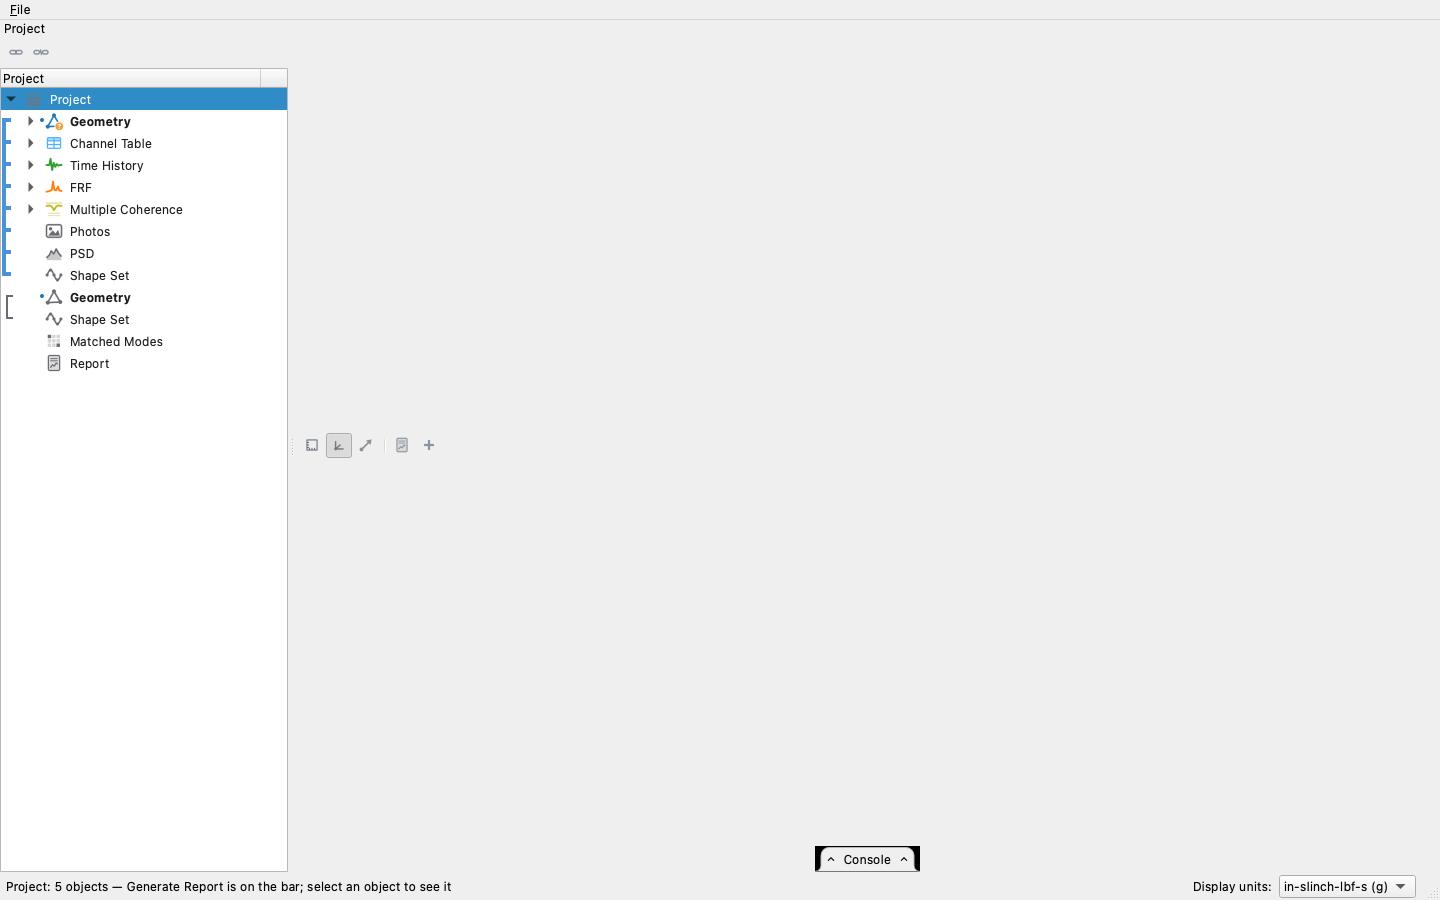
The top row is the project. Under it, one row per object, in a fixed
order by kind — geometries and photographs first, then the channel
table, time data, spectra, requirements, shape sets, matched modes and
the report — so the same project always reads the same way. A blue
bracket down the left joins the objects of one object group, with the
Basis group's bracket first (Projects, links, and the Basis).
An object group can be named — right-click its bracket, Name Object
Group…, or project.link(..., name=...) — and the name runs up the
bracket in its color; it is what the group is called when the project
is written as an Engineering Sciences Common Data Format file, where an
object group is an activity.
A project with a type shows a gray row for every object its report still expects. Right-click one for what can fill it, or press Automatic on the bar above the tree to have every slot the loaded data can fill computed at once and the report generated (Reports).
Every object that holds more than one thing expands into a grid: rows are coordinates (or modes, or photographs), columns are whatever tells one record from another — the reference of a matrix of measurements, the capture of a repeated one, a single column when the row alone is the identity. Each cell's icon says what that record measures. Selecting cells picks records; a whole object is the object's row. A coordinate is typed over by double-clicking it (The objects).
A time history's grid has one more column, first: Role, what each
channel is to an FRF — ref (a reference: it drives), resp (a
response: it answers) or mon (a monitor: recorded, in no FRF). FRFs
and multiple coherence run from the references to the responses. Click
a role to change it. With no channel table, a force starts as a
reference, an acceleration, velocity or displacement as a response, and
anything else — volts, pressure, strain, temperature, a channel whose
quantity is not declared — as a monitor (a moment and a rotation follow
the force and the motion). A history imported with its channel table
takes the roles the table states — a Rattlesnake file marks the
channels it drove.
The time data's roles are the truth, and a channel table linked
with the data it describes shows them: change a role on the data's grid
or in the table's Role column and both change. Linking a channel table
to time data afterwards counts as the table's import — every role the
table declares is given to the data, a channel it leaves blank keeps
the data's role, and the status bar says which roles the link moved. A
table that describes none of the data's channels is left alone. A
channel's Control check and its role are independent: a controlled
channel can be a reference, a response or a monitor. A role is a
channel's,
not a point's: a drive point's load cell and the accelerometer beside
it are two rows, and making the accelerometer the reference gives
acceleration over acceleration, a transmissibility. The roles ride the
history (history.roles, {(DOF, quantity): role}), are saved with it
and journaled, and anything computed under the old roles wears the
refresh badge.
Clicking the project row shows nothing on the right — the panes clear, and the bar carries the project's two acts: Generate Report, and + New Geometry, an empty geometry in the display length unit to build a model in with Add Plane (the finite element workflow).
One object at a time
| selected | what the right side shows |
|---|---|
| Geometry | The 3-D scene: nodes, coordinate systems and elements, listed by family — Beams, Triangles, Quads, Tetras, Wedges, Hexes — with the element groups of each family under it and an element group's elements under the element group. Picking a family, an element group or an element shows that part; the pencil on a family opens its elements' table, on an element group the Element Groups table on its row, where its material and section are set. The Rigid Body reading previews the six rigid-body shapes about a reference point. |
| Photos | The photographs, one at a time; a name is edited in the grid. |
| Channel table | The spreadsheet: every column typed, the drop-downs and check boxes live (The channel table). |
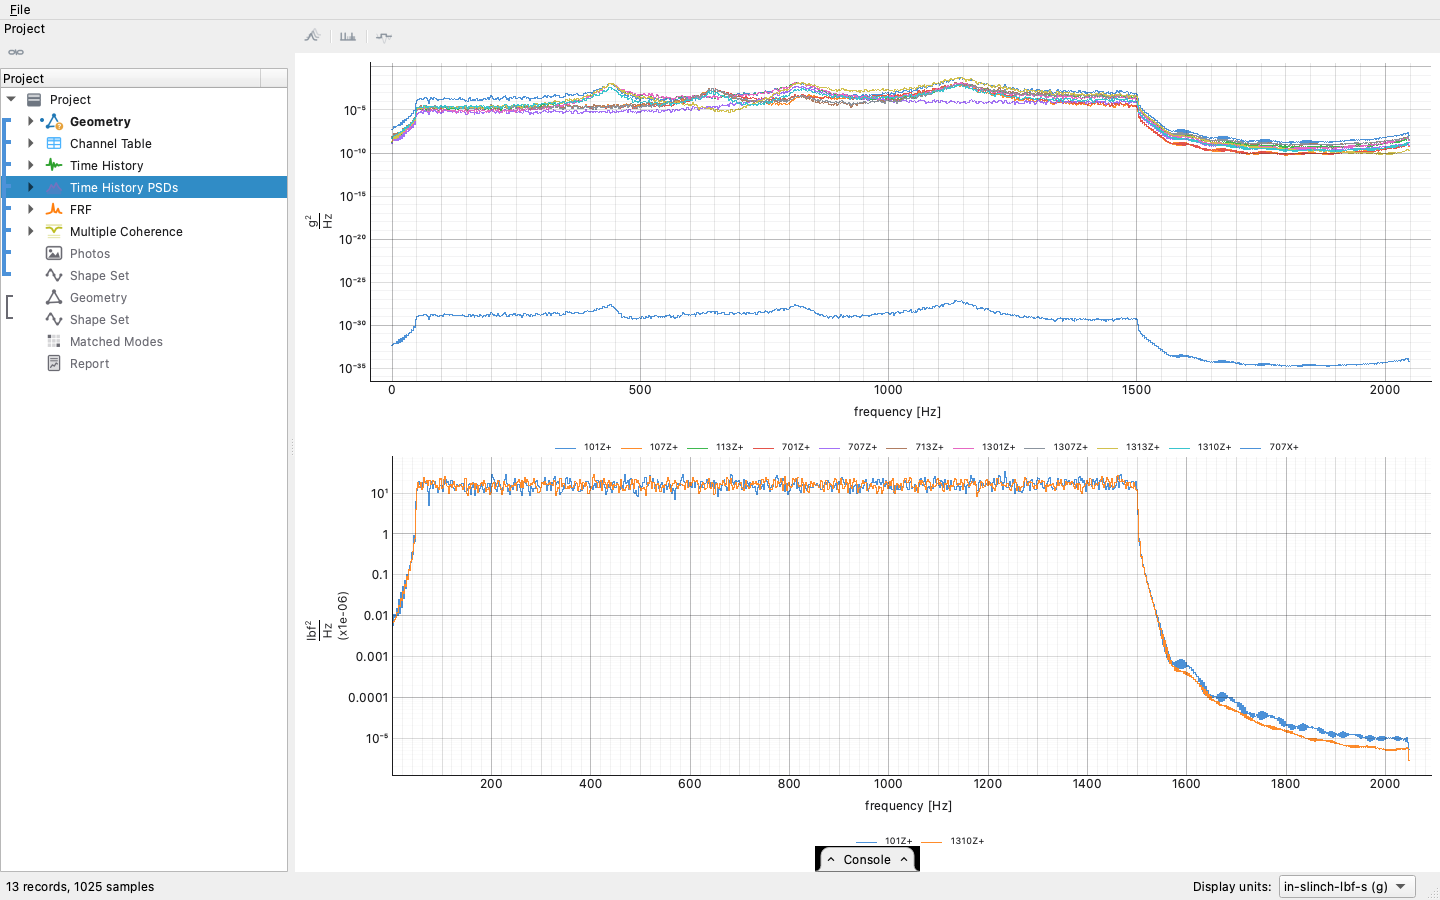
| Time history | The record against time, with the averaging frames or the shock windows shaded when they are set, and the readings a record offers on its bar: averaging, filter, truncate, kurtosis, shocks, wavelet. |
| Spectrum, PSD | The curves, or the 3-D stage with the channels receding, colored by level — the stage is the default and 3D on the bar switches. An octave-band PSD draws as steps. |
| Specification | Each channel's target with its warning and abort bands, one channel at a time from the drop-down; RMS on the bar reads the levels as bars over a table; Edit opens the sheet (The objects). |
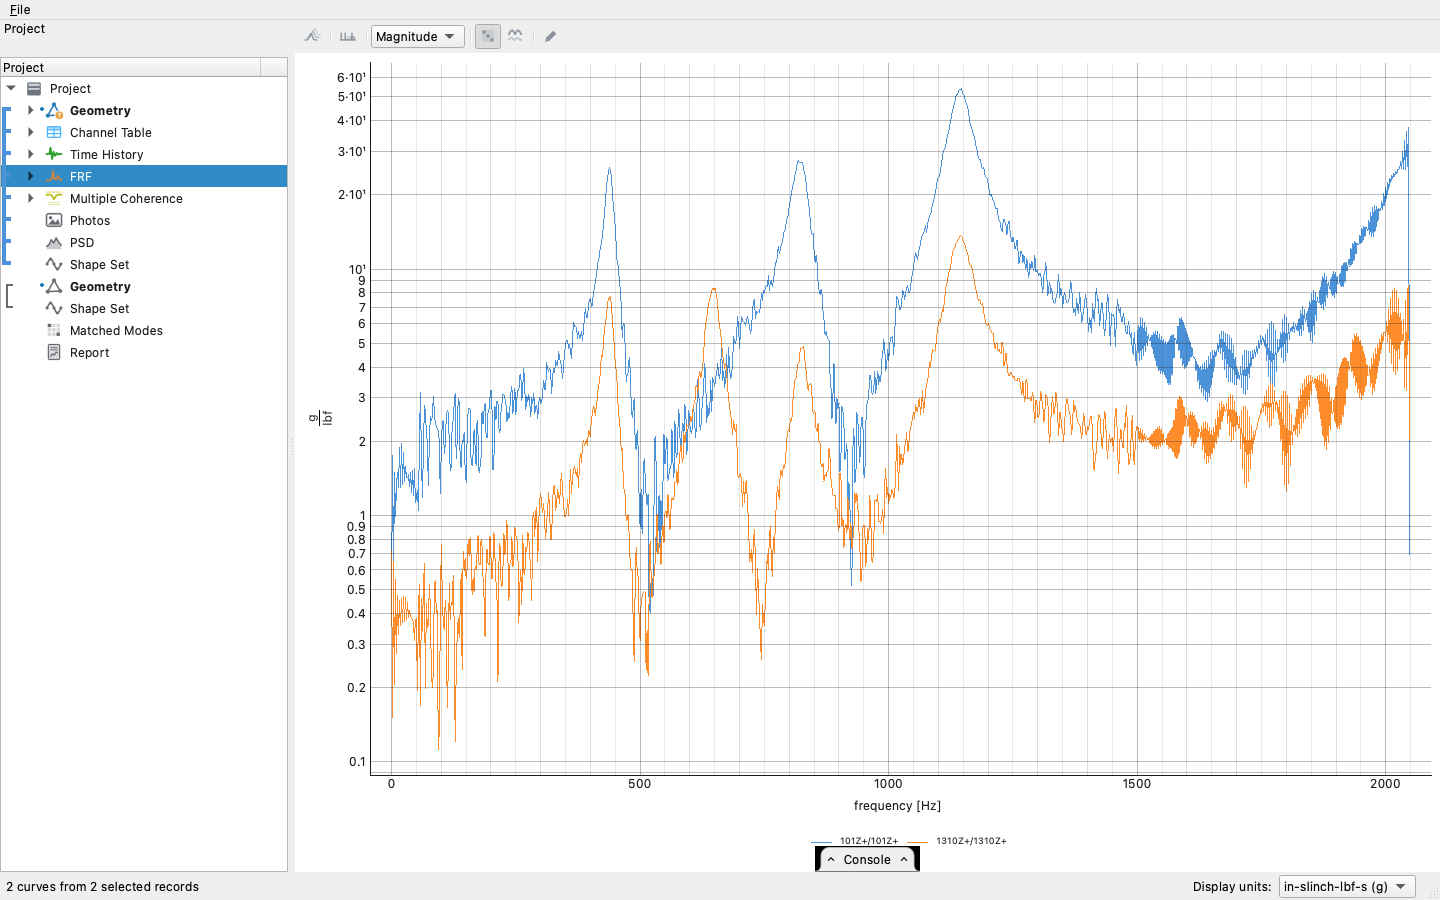
| FRF | The curves, filtered to the drive points or one component from the bar, the CMIF, or the stage. |
| Coherence | The map: frequency across, channel down, pinned 0 to 1. |
| SRS | Every event of a channel on log axes. |
| Shock specification | The required SRS with its band. |
| Sine sweep specification, sine levels | One row per control DOF, the tone on the bar's drop-down: the requirement, the extracted level, or the level against the requirement when both are selected. |
| Shape set | The table of modes: frequency, damping and the shape's label; a mode picked in the grid is the one the table highlights. |
| Matched modes | The table of committed pairs, both sets' parameters side by side. |
| Report | The report editor: the page as the export will read it, its acts on the bar (Reports). |
Two things together
Hold Cmd (Ctrl on Windows and Linux) and click a second row, or pick cells in a second grid. What the pair shows is decided by what the two are; a pair that means nothing shows each on its own. Every reading below is a named test in the suite, so it does not quietly stop working.
Data on a geometry
A geometry selected with one data object moves the geometry with the data. The animation controls come up on the bar: play, faster and slower, the scale, and a cursor on the plot beneath that the scene follows.
| geometry + | the scene shows |
|---|---|
| a shape set | The mode shape animating; the mode box picks which. Every mode's DOFs that are on the geometry move; the rest are named in the status line. |
| a time history | The geometry deflecting sample by sample, proportional to what each channel measured; drag the cursor on the record or press Play. DOF arrows mark where each channel is. |
| an FRF or a spectrum | The operating deflection shape at one frequency line — magnitude and phase per channel — moving; the cursor on the plot picks the line. |
| a PSD of autospectra | The envelope: the geometry deflected ±√PSD, colored by decibels below the loudest node at the cursor's line — where the article is loudest, without the phase a PSD does not have. |
| a whole CPSD | The principal shape: the dominant eigenvector of the cross-spectral matrix at each line, each channel's phase relative to the others. |
| a picked reference column of a CPSD | The operating deflection shape relative to that reference — the same shape the FRF gives, from operating data. |
| a second geometry | Both overlaid — a test geometry over the model it was built from. |
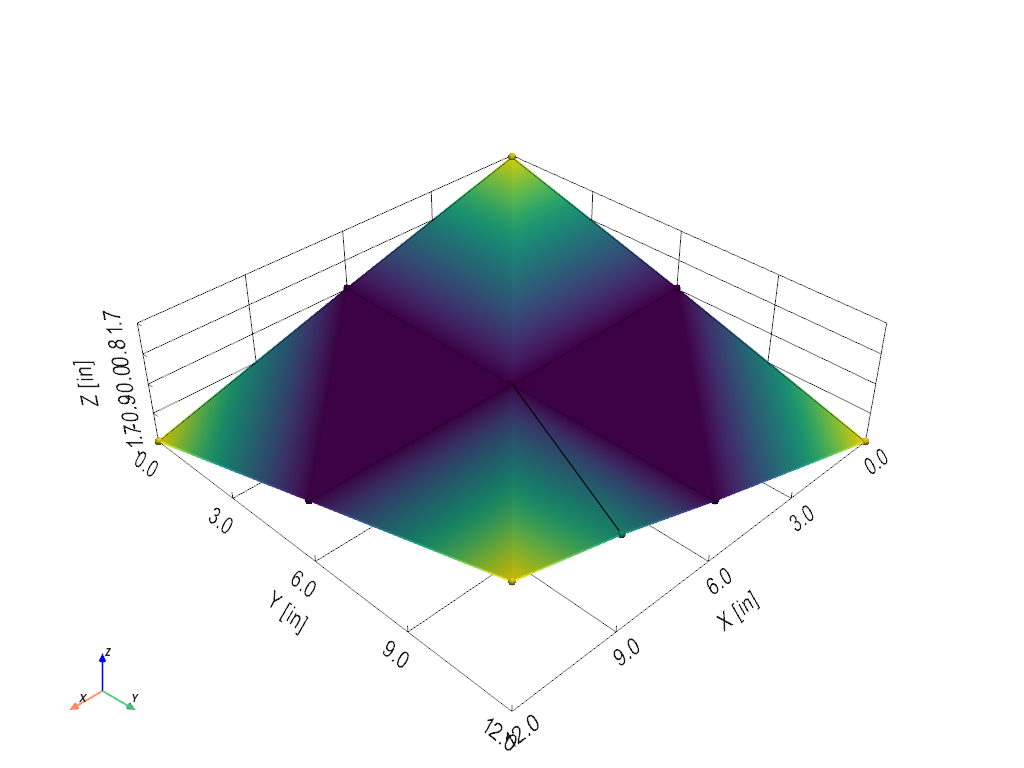
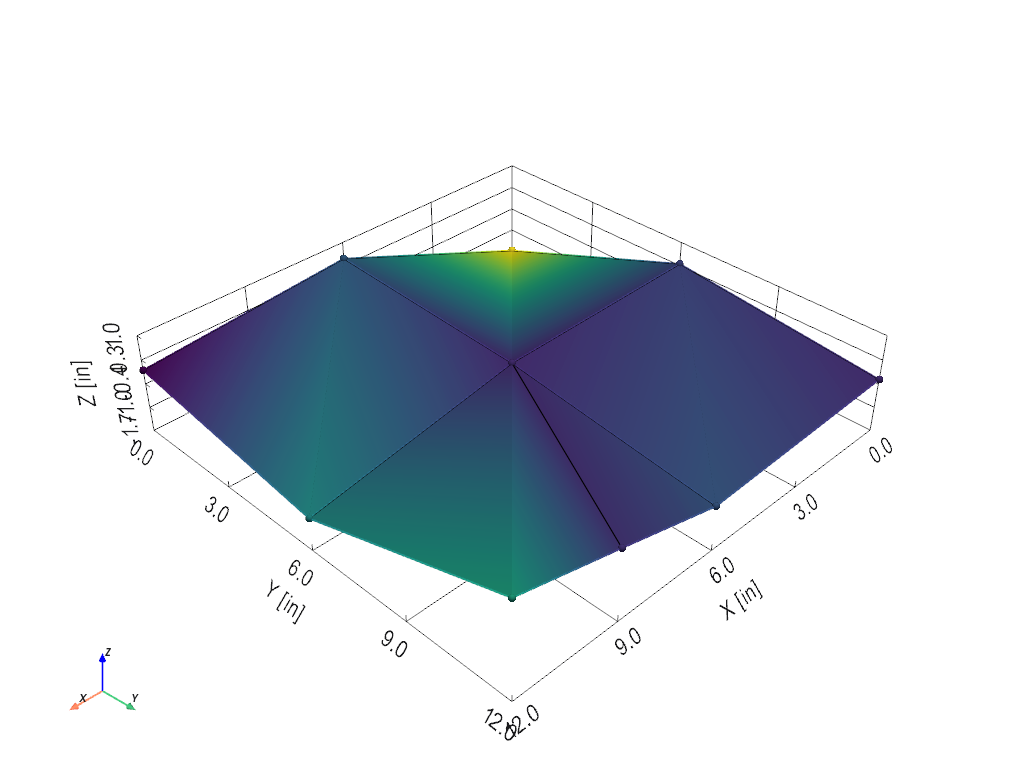
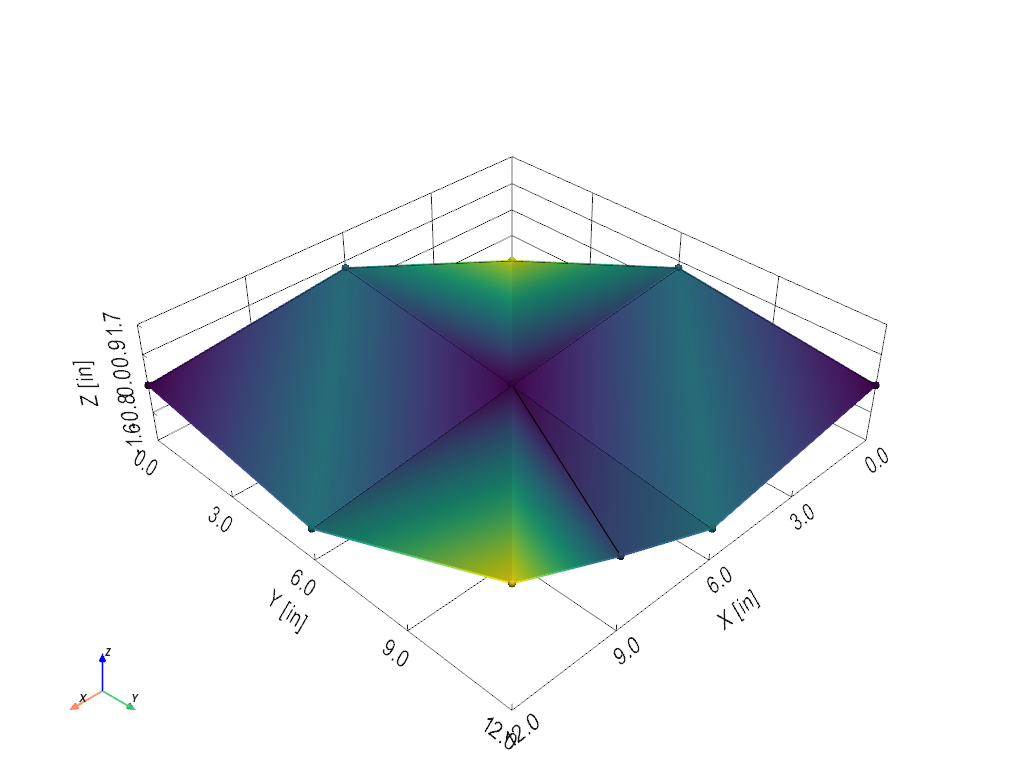
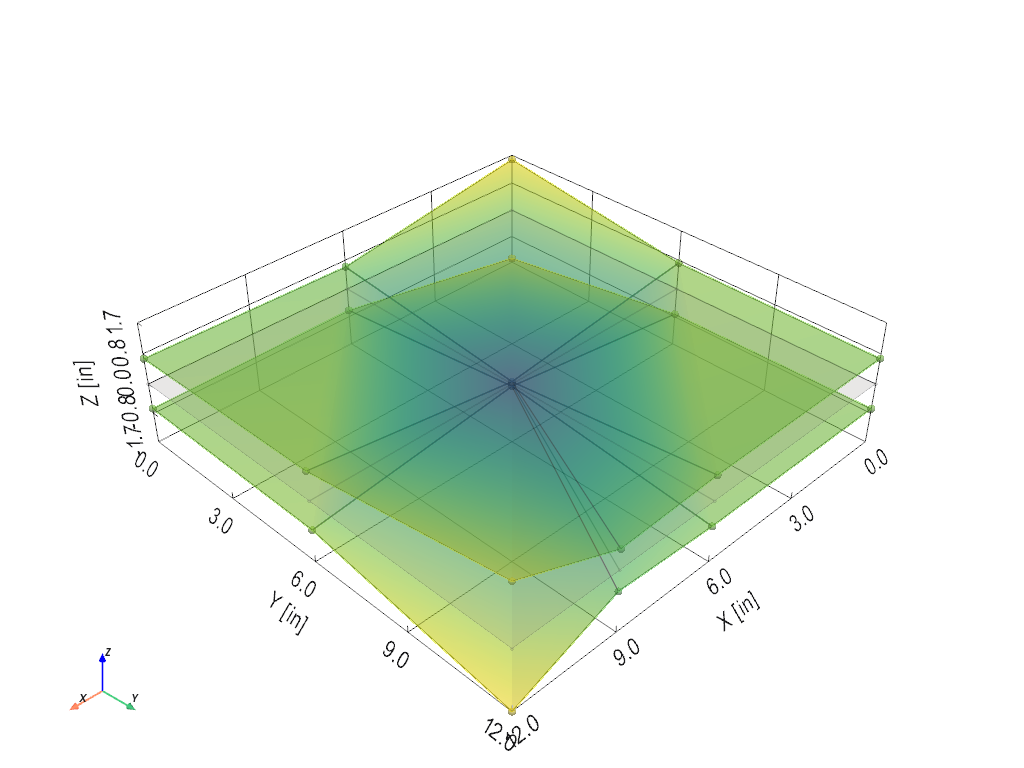
Picking records in the data object's grid restricts the animation to them; picking a quantity for the DOF arrows on the bar marks every DOF the selected data measures as that quantity.
Two shape sets
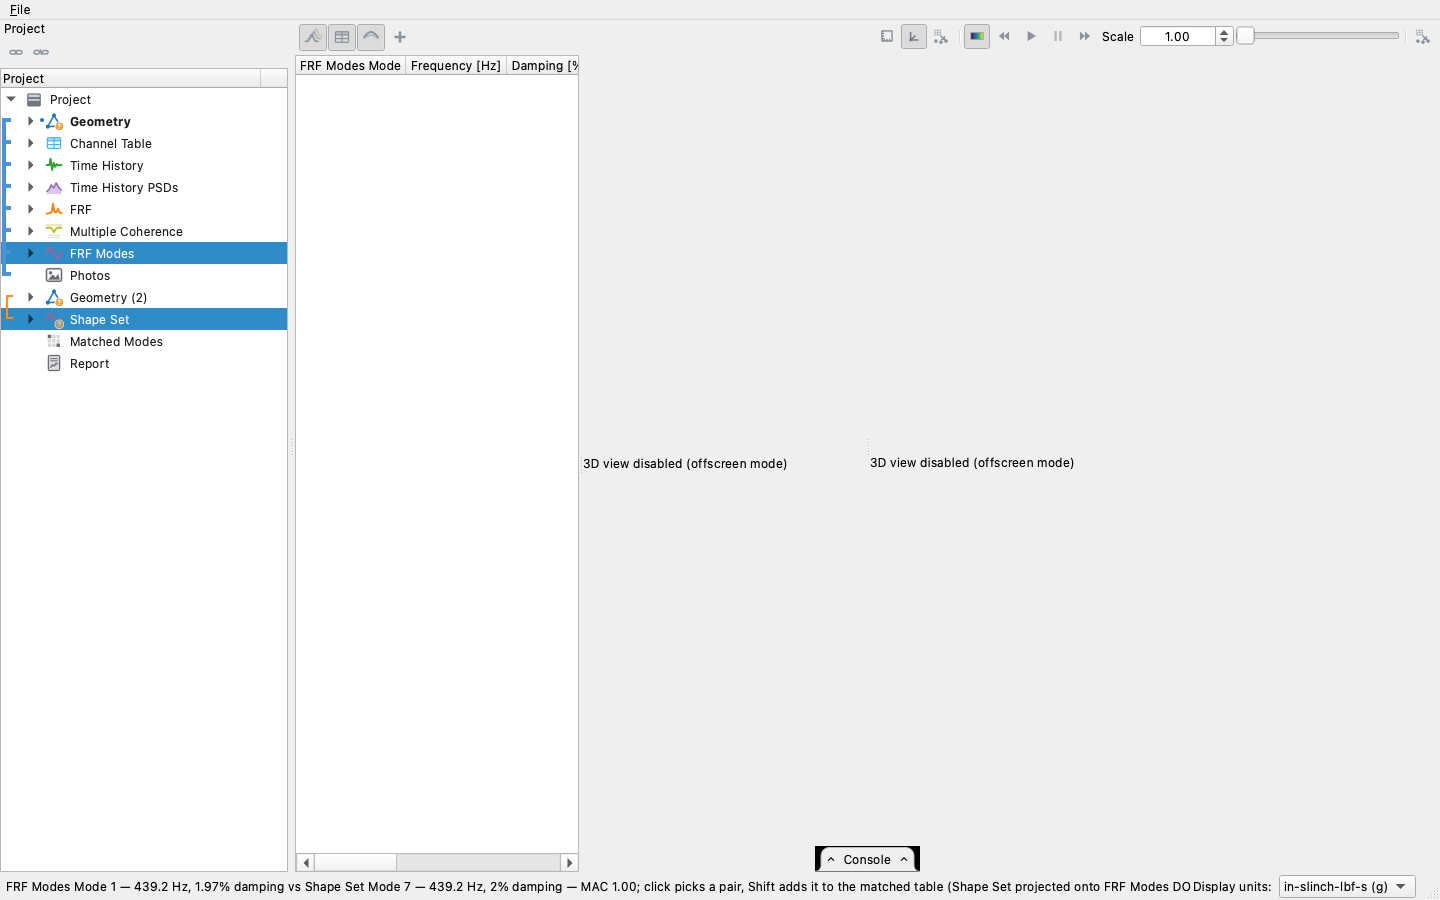
Two shape sets together give the MAC: the matrix of the two, each pair's assurance criterion, with the cross-geometry projection when the sets live on different geometries. Click a cell to compare that pair; with a geometry selected too, the Overlay toggle animates the two shapes over each other, phase-aligned. Add Matches (the + on the bar) commits the selected squares into the matched-modes object for that pair of sets.
An FRF and a shape set
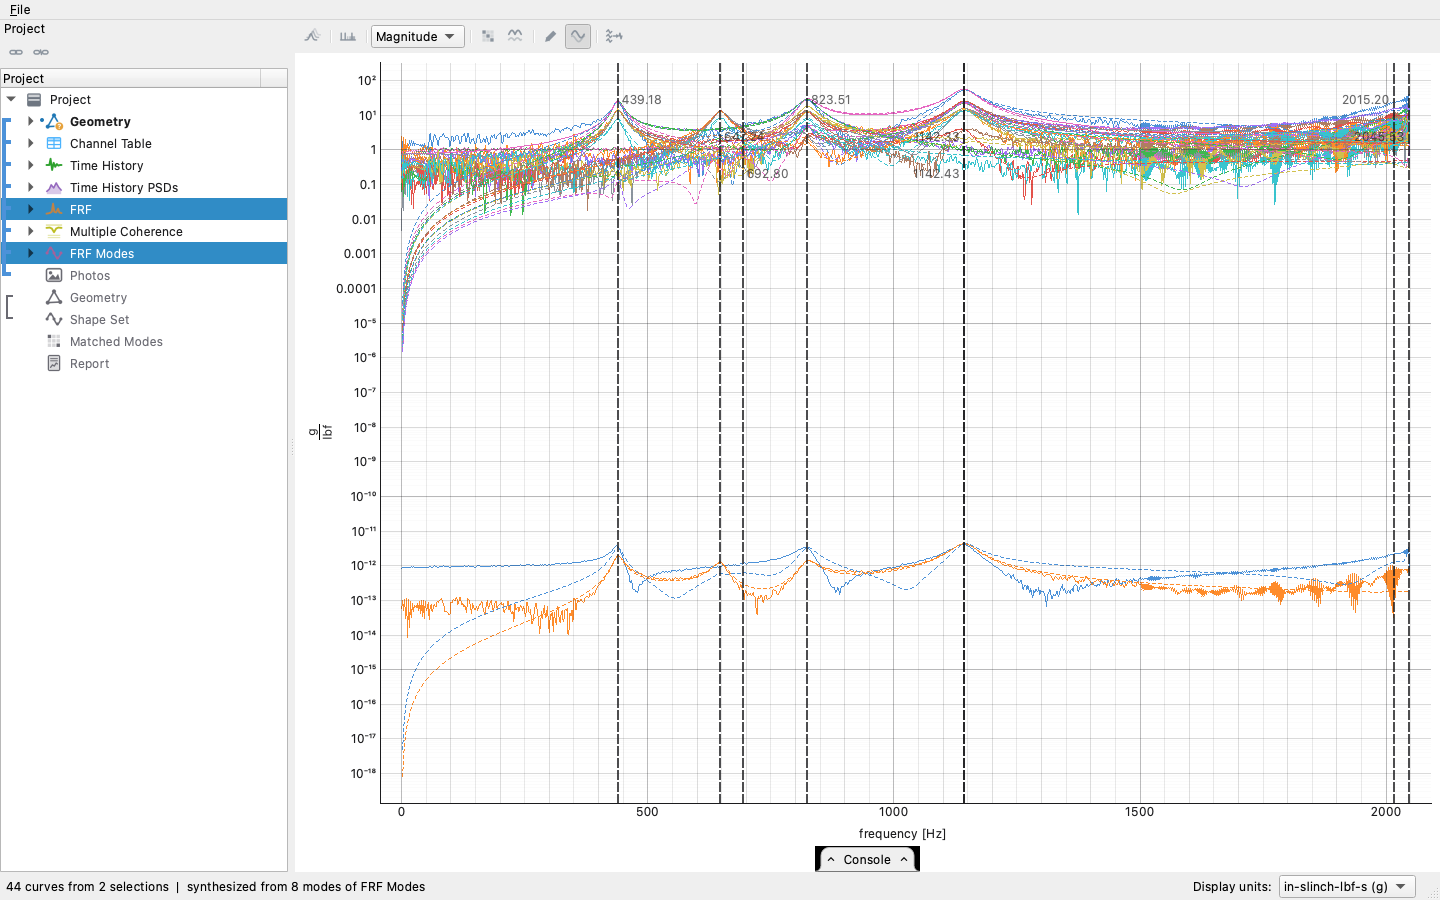
An FRF beside a shape set reads two ways, and the choice sticks. Edit Fit opens the mode fitter on the FRF with the set as its starting point (How the mode fitting works). Resynthesis draws the FRF the set predicts, dashed, under the measured one, so a fit is judged against what it was fitted to.
A measurement and its requirement
A measured object beside the requirement it had to meet is a comparison, and a comparison has its own readings on the bar: the spectra (the 3-D stage with every channel and its bands, or one channel at a time flat), the bars (one signed number per channel), and the table under either.
| pair | the comparison |
|---|---|
| PSD + specification | Each channel's measured spectrum against its target and bands, the lines outside an abort limit boxed; the RMS level error per channel as bars; scaled to the specification when the run was captured below full level (How a PSD means its area). |
| SRS + shock specification | Every event of a channel against the required SRS; the RMS decibel deviation per event as bars. Pick one event's records and only that event is compared. |
| time history + transient specification | The measured waveform over the one it was controlled to, aligned; the waveform error per channel per playing. |
| sine levels + sine sweep specification | The level each tone reached against the level required, tone by tone. |
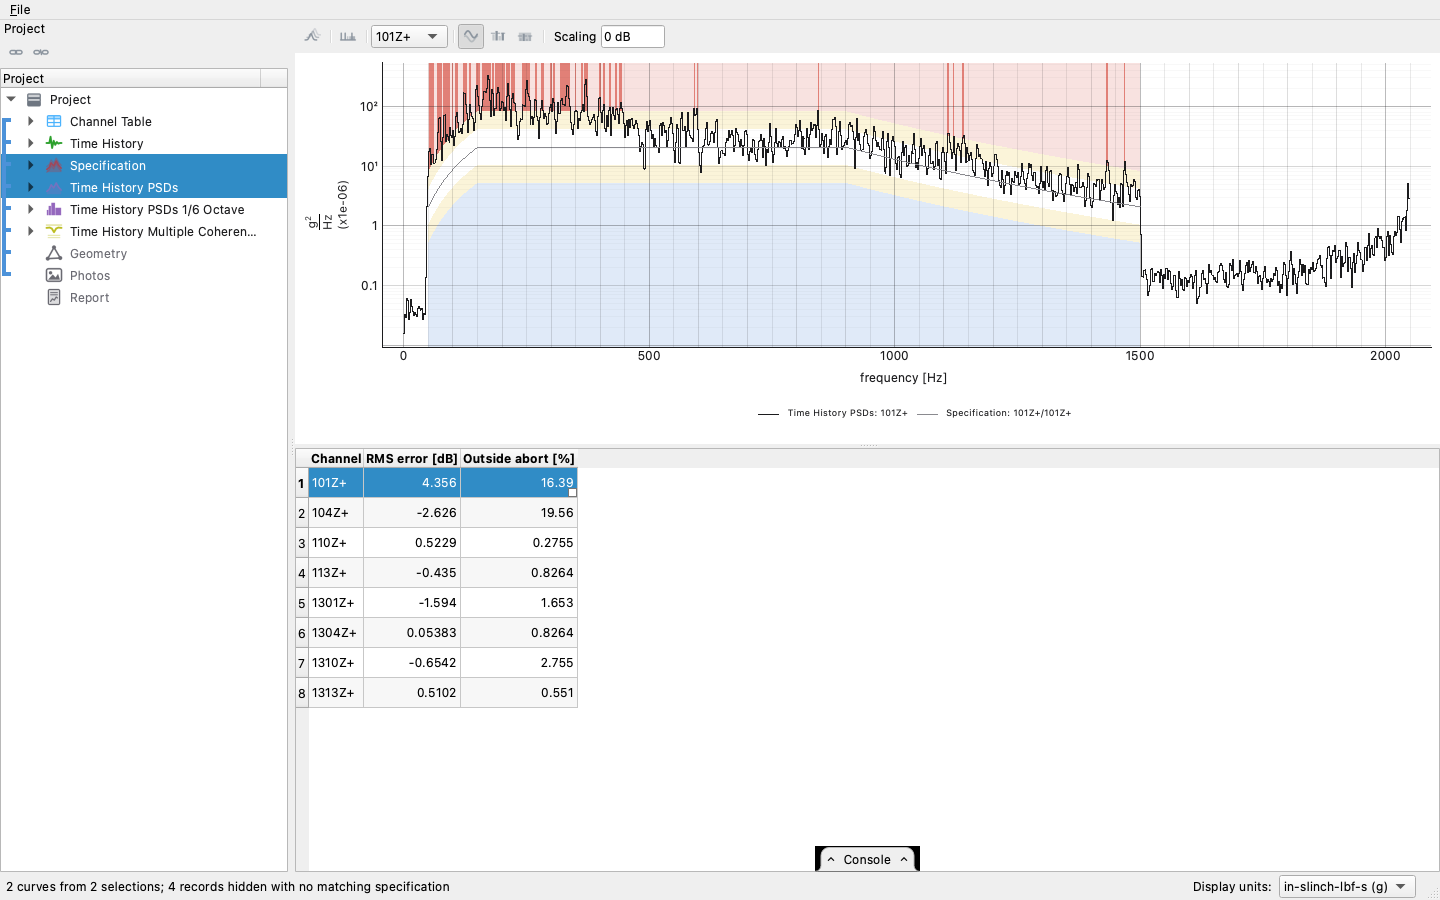
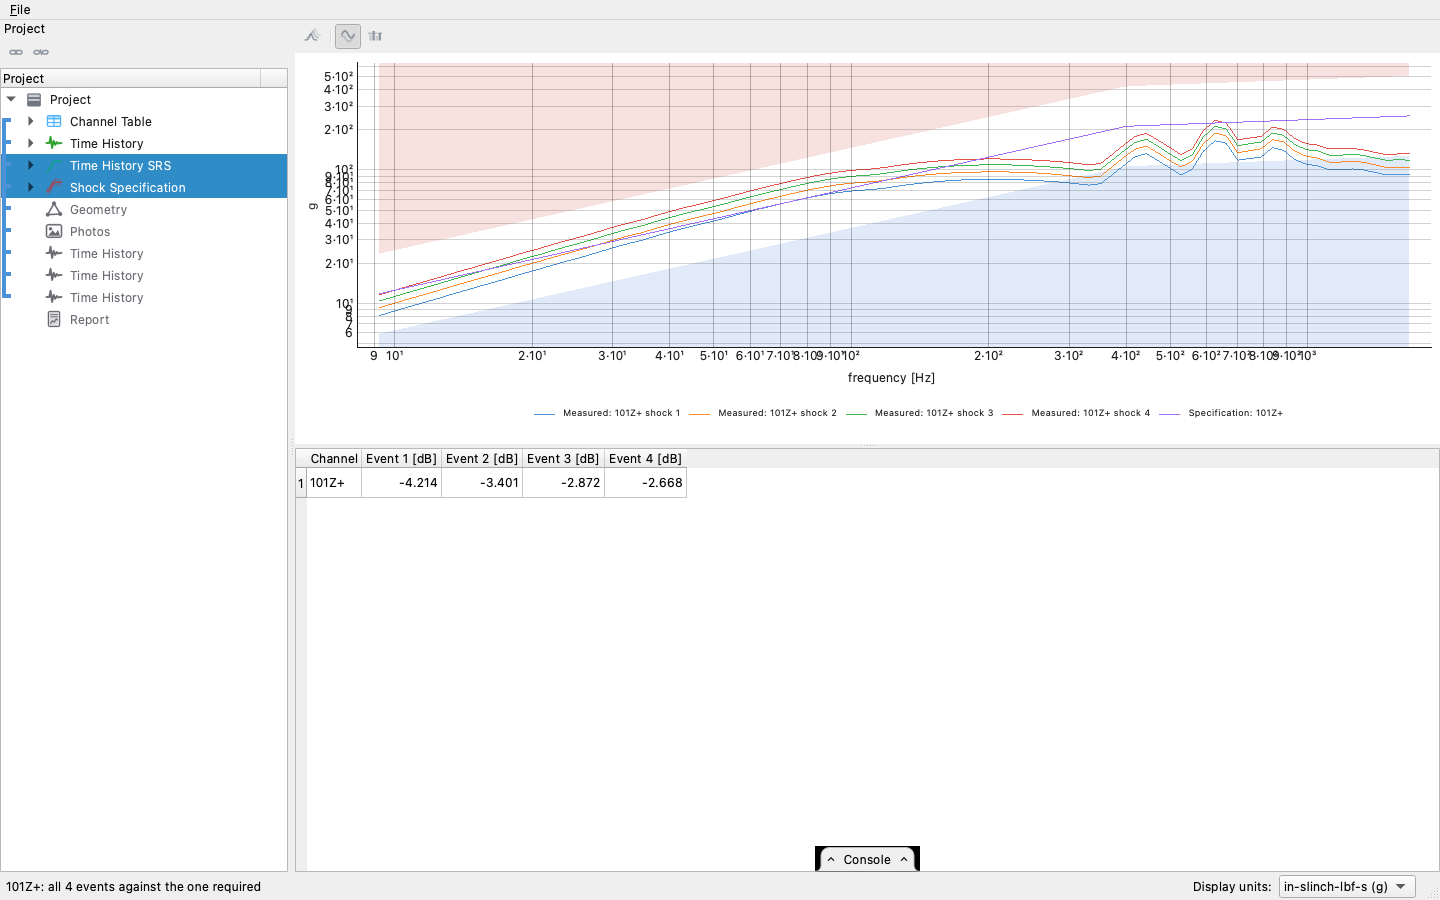
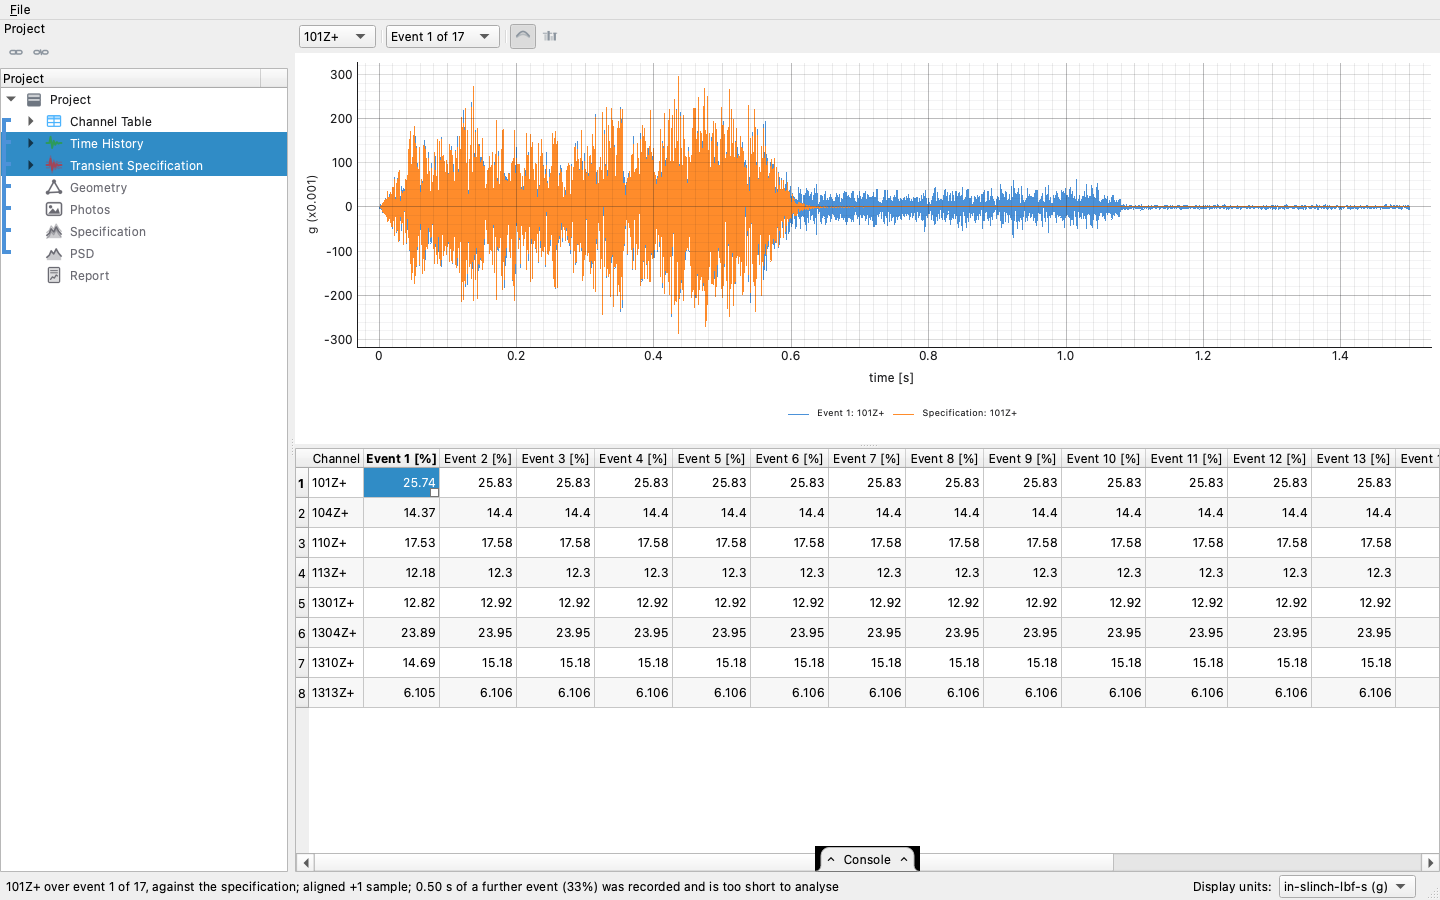
Picks name the channels: a channel picked on the specification, or on the measurement, is the channel the comparison draws, and picks on both sides have to agree — a record and a target that share no coordinate is not a comparison, and the status line says so rather than drawing one against the other.
Everything else
Photographs show beside any selection that draws no data; a report selected with anything else keeps its editor up; a geometry or a shape set stays selected while records are picked in a grid, because the records are what animate on it, and other data objects give way to a grid pick unless the modifier is held. What an act needs is on the bar the moment the selection can take it — a record and a set offer Transform to Modal Responses, two sets on two geometries Project onto Basis DOFs, siblings of one type Merge into One — and the same rule that decides the reading decides the acts (Projects, links, and the Basis).